Statistical Process Control (SPC)

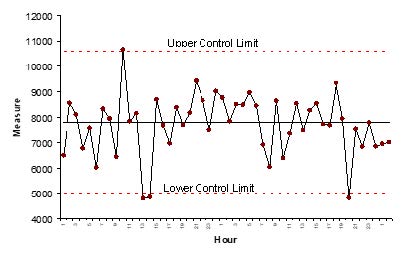
Statistical process control (SPC) is the application of statistical methods to the measurement and analysis of variation in a process using control charts. Control charts are visual tools that apply the techniques of statistical process control to detect special causes of variation. statistical process control may be applied to parameters that describe either the input (process) or the output (product or service produced by the process). The goal of using a control chart is to reduce variation. An upper control limit (UCL), lower control limit (LCL) and center line (CL) are plotted as points of reference on a run chart of the parameter to determine if the parameter is ‘in control’ or ‘out of control’. The placement of the UCL, LCL and CL is determined using historical performance based on type of control chart.
Workshop
Description: interactive workshop engages manufacturing personnel (engineers, quality, production) in understanding SPC and applying it to their process/product. It is recommended participants have the equivalent of high-school algebra knowledge. Hands-on activities are incorporated throughout the training to provide practice and confidence in using the statistical tools. Ideally, at least one activity involves data from the organization’s processes or products. At the end of the session, participants will:
– Understand basic statistical concepts and measures and be able to create basic graphs to explore statistical properties of data and troubleshoot unstable situations.
– Know how to select the proper control chart for a given type of data and calculate appropriate control limits.
– Know how to interpret control charts for both control and improvement.
– Understand the organization and maintenance of an SPC system.
Length: one-day (8 hours) or two-half days (4 hours each)
Materials: training materials, laminated job aids, and Memory Jogger 2 book for each participant
The workshop may be modified to use Minitab20® statistical analysis software.
